Data Visualization with Advanced Excel
This Coursera curriculum was designed to provide hands-on instruction for advanced uses of Excel 2013. It gets beyond Excel basics and covers simulation analysis and more advanced Excel applications. It also goes deep into data visualization, helping to distinguish it from the multitude of introductory and overview classes in Excel.
Created by: Alex Mannella
Produced in 2018
 What you will learn
- Developing databases and data models.
- Advanced scenario analysis.
- Data visualization.
- Dashboarding.
 Quality Score
Overall Score : 96 / 100
 Live Chat with CourseDuck's Co-Founder for Help
 Course Description
 Pros
Pros
 Cons
Cons
-
- Course gets far beyond the introductory basics. Instead of learning shortcuts to edit cells, you will learn how to do powerful analytics with Excel features.
- Practical sessions ensure that you aren't loosely following along with lectures. You will have to master these lessons to complete the curriculum.
- Course focuses on creating unique Excel outputs. You aren't just drawing basic scatter plots. You'll be crafting your own approach to using Excel analytics.
-
- This course is not for beginners. A strong background in Excel is assumed.
- The course was built from Excel 2013. There are subtle changes to newer versions and it can cause confusion and minor roadblocks to completing tasks if you aren't on Excel 2013.
- The course is challenging even for experienced Excel users.
 Instructor Details

- 4.8 Rating
 122 Reviews
Alex Mannella
Alex Mannella was a founding member and Partner in PwC's Information and Analytics Practice and is a seasoned professional on the issues of customer value management (CVM), response modeling, database marketing, and data mining. He has extensive experience in developing response and segmentation algorithms for organizations of varying sizes, database development, and the use of artificial intelligence for data mining studies. Prior to joining PwC, Alex was head of research at Econometrics, Inc.. He was instrumental in the redesign of their national database of more than 180 million records for response modeling, data mining and direct marketing campaigns. In addition, Alex played a key role in the development of the life-stage variable at Econometrics, a variable that is a key component in CRM and market basket analysis. Alex is an active member of the American Statistical Association (Chicago Chapter) and the Chicago Association of Direct Marketing. Alex is a guest lecturer at UCLA, Stanford, ITAM (Mexico), Universidad de los Andes (Colombia), IIM-B, and ISB. In addition, Alex sits on an advisory board at the University of Chicago Graham School.
 Students also recommend
-
Microsoft Excel - Online Tutorial for Beginners (2010)
-
0.0 (0 Reviews)
-
 Provider: Chandoo.org
 Time: 1h 30m
Free
 Reviews

- Video Duration:
 10h
10h - Price: Free 0 Track Price
- Provider: Coursera
- Year:
 2018
2018 - Level:
 Advanced
 - Language:
 English
 - Certificate:
 Yes
Yes
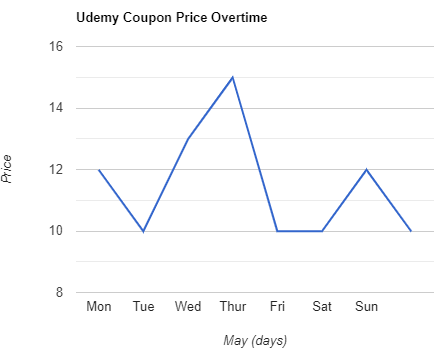
Coursera Coupon Price Tracker