Quality Score
Content Quality
/
Video Quality
/
Qualified Instructor
/
Course Pace
/
Course Depth & Coverage
/
Overall Score : 0 / 100
 Live Chat with CourseDuck's Co-Founder for Help
Need help deciding on a javascript course? Or looking for more detail on Emma Saunders's DC.js for Data Science Essential Training? Feel free to chat below.
Join CourseDuck's Online Learning Discord Community
 Course Description
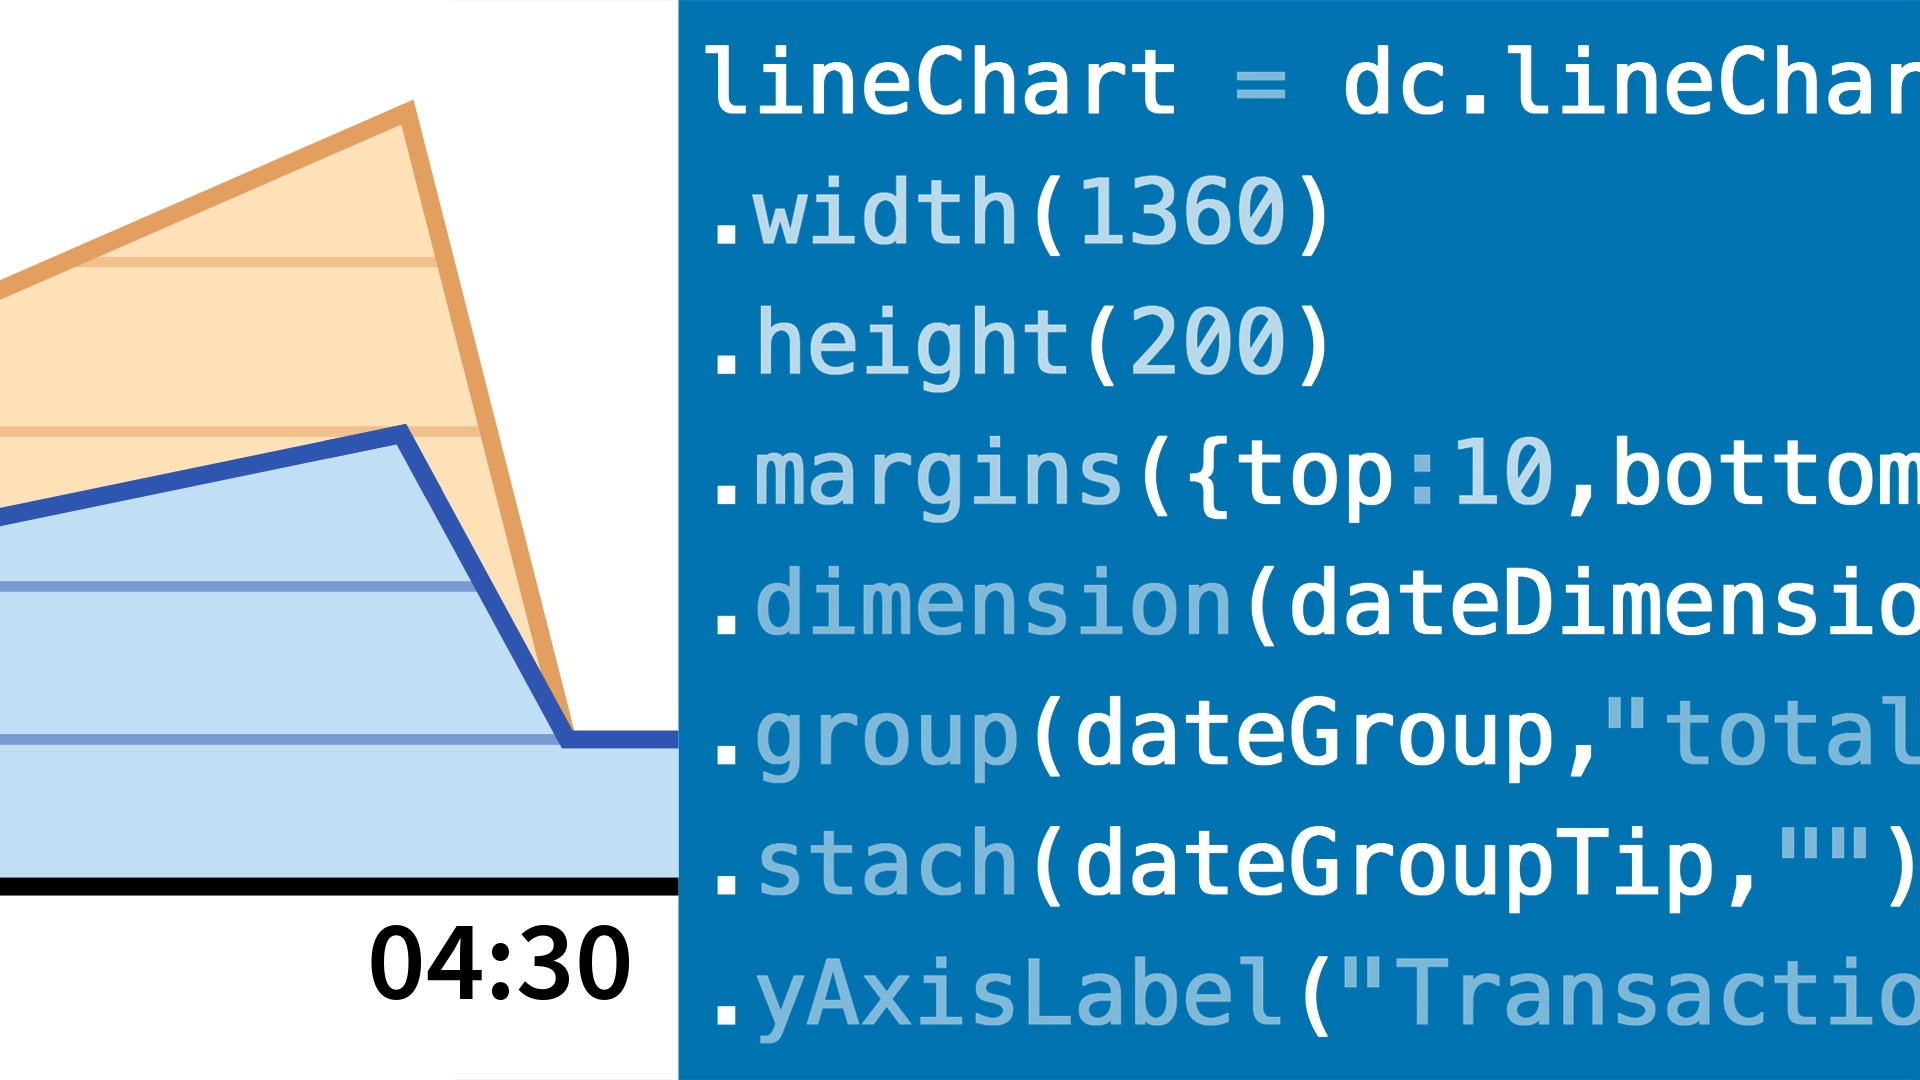
Dimensional charting (DC) allows data visualization to display in dashboard widgets as bar charts, scatterplots, heat maps, and more. DC.js is an open source JavaScript library based on Crossfilter and D3.js. In this course, learn how to build interactive, web-based dashboards. Instructor Emma Saunders covers all 20 built-in classes, the suite of included chart types, and the built-in formatting options available in DC.js. Learn how to use jQuery and bootstrap, apply filters, restyle existing dashboards, create custom charts, pair data using DC and D3, link charts, and more.

 Students also recommend

-
JavaScript Tutorial for Beginners by The Net Ninja (2015)
-
4.9 (21 Reviews)
-
 Provider: YouTube
 Time: 5h
Free
 Reviews
- Video Duration:
 2h 58m
 - Price: Free 0 Track Price
- Provider: Lynda
- Year:
 2017
2017 - Level:
 Intermediate
 - Language:
 English
 - Certificate:
 Yes
Yes
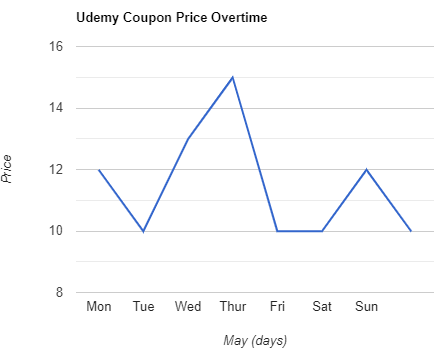
Lynda Coupon Price Tracker