Applied Plotting, Charting & Data Representation in Python
The 5 courses in this University of Michigan specialization introduce learners to data science through the python programming language. This skills-based specialization is intended for learners who have a basic python or programming background, and want to apply statistical, machine learning, information visualization, text analysis, and social network analysis techniques through popular python toolkits such as pandas, matplotlib, scikit-learn, nltk, and networkx to gain insight into their data.Introduction to Data Science in Python (course 1), Applied Plotting, Charting & Data Representat
Created by: Christopher Brooks
 Quality Score
Content Quality
/
Video Quality
/
Qualified Instructor
/
Course Pace
/
Course Depth & Coverage
/
Overall Score : 90 / 100
 Live Chat with CourseDuck's Co-Founder for Help
Need help deciding on a artificial intelligence course? Or looking for more detail on Christopher Brooks's Applied Plotting, Charting & Data Representation in Python? Feel free to chat below.
Join CourseDuck's Online Learning Discord Community
 Course Description
This course will introduce the learner to information visualization basics, with a focus on reporting and charting using the matplotlib library. The course will start with a design and information literacy perspective, touching on what makes a good and bad visualization, and what statistical measures translate into in terms of visualizations. The second week will focus on the technology used to make visualizations in python, matplotlib, and introduce users to best practices when creating basic charts and how to realize design decisions in the framework. The third week will be a tutorial of functionality available in matplotlib, and demonstrate a variety of basic statistical charts helping learners to identify when a particular method is good for a particular problem. The course will end with a discussion of other forms of structuring and visualizing data. This course should be taken after Introduction to Data Science in Python and before the remainder of the Applied Data Science with Python courses: Applied Machine Learning in Python, Applied Text Mining in Python, and Applied Social Network Analysis in Python.
 Instructor Details

- 4.5 Rating
 116 Reviews
Christopher Brooks
Christopher Brooks is a Research Assistant Professor in the School of Information and Director of Learning Analytics and Research in the Office of Digital Education & Innovation at the University of Michigan. His research focus is on the design of tools to better the teaching and learning experience in higher education, with a particular interest in understanding how learning analytics can be applied to human computer interaction through educational data mining, machine learning, and information visualization.
 Reviews
- Video Duration:
 17h
17h - Price: Free 0 Track Price
- Provider:
 Coursera
 - University:
 University of Michigan
 - Language:
 English
 - Certificate:
 Yes
Yes
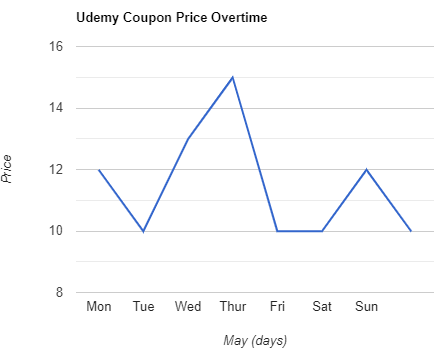
Coursera Coupon Price Tracker