Excel Data Visualization Part 2: Designing Custom Visualizations
Created by: Chris Dutton
Produced in 2018
 Quality Score
Content Quality
/
Video Quality
/
Qualified Instructor
/
Course Pace
/
Course Depth & Coverage
/
Overall Score : 0 / 100
 Live Chat with CourseDuck's Co-Founder for Help
Need help deciding on a excel course? Or looking for more detail on Chris Dutton's Excel Data Visualization Part 2: Designing Custom Visualizations? Feel free to chat below.
Join CourseDuck's Online Learning Discord Community
 Course Description
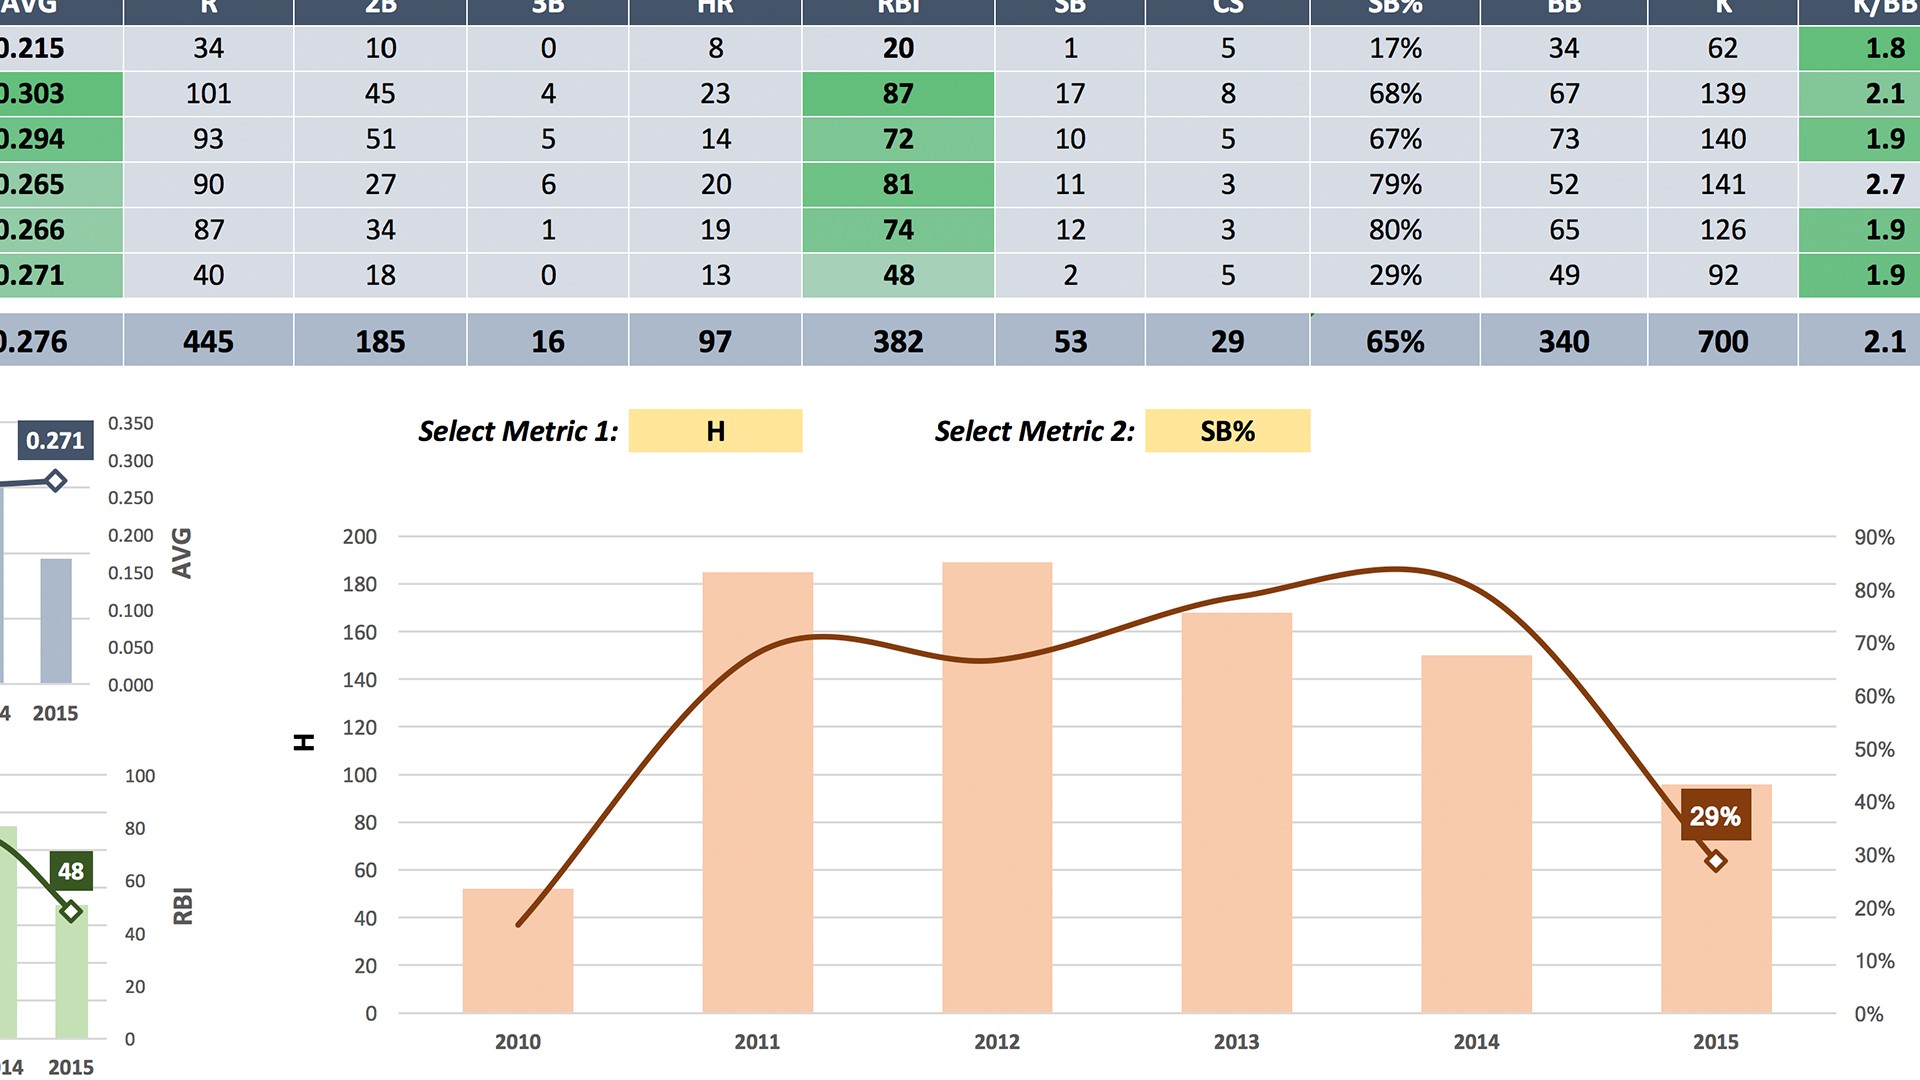
series- "instructor Chris Dutton steps through how to create unique, custom data visualizations in Excel. Since Chris covered the core data visualization capabilities of Excel in the previous installment of the series, he dives into some more sophisticated techniques here. As he moves through a series of hands-on demos, Chris covers everything from building dynamic dashboards to advanced maneuvers like value-based formatting and dynamic series selection.

 Students also recommend
-
Microsoft Excel - Online Tutorial for Beginners (2010)
-
0.0 (0 Reviews)
-
 Provider: Chandoo.org
 Time: 1h 30m
Free
 Reviews
- Video Duration:
 2h 3m
2h 3m - Price: Free 0 Track Price
- Provider: Lynda
- Year:
 2018
2018 - Level:
 Intermediate
 - Language:
 English
 - Certificate:
 Yes
Yes
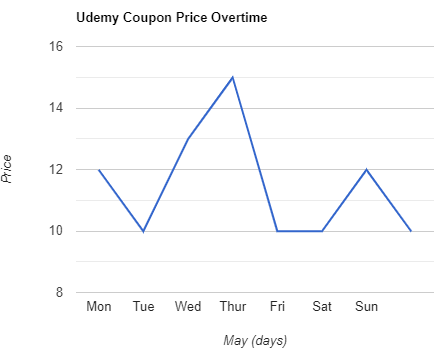
Lynda Coupon Price Tracker