Information Visualization: Applied Perception
This is Unity's official series of courses designed to prepare you for the Unity Certified Programmer exam, the certification for entry- to mid-level Unity programmers. You'll gain practice and experience in each of the topics covered in the exam through hands-on problem solving challenges. You'll build two complete Unity projects end-to-end, implementing core interactivity, supporting systems, and platform optimizations This series of courses is for Unity programmers with 1-2 years of experience who are ready to bring their existing skills up to a professional standard.
Created by: Enrico Bertini
 Quality Score
Content Quality
/
Video Quality
/
Qualified Instructor
/
Course Pace
/
Course Depth & Coverage
/
Overall Score : 98 / 100
 Live Chat with CourseDuck's Co-Founder for Help
Need help deciding on a invision course? Or looking for more detail on Enrico Bertini's Information Visualization: Applied Perception? Feel free to chat below.
Join CourseDuck's Online Learning Discord Community
 Course Description
This module aims at introducing fundamental concepts of visual perception applied to information visualization. These concepts help the student ideate and evaluate visualization designs in terms of how well they leverage the capabilities of the human perceptual machinery.
 Instructor Details

- 4.9 Rating
 13 Reviews
Enrico Bertini
Enrico Bertini is Associate Professors in the Computer Science and Engineering department at NYU Tandon School of Engineering. He has taught courses on visualization and visual analytics for more than 10 years in public and private institutions across Europe and the United States. Prof. Bertini's research focuses on the development and evaluation of advanced visual interfaces for Data Science. He has numerous publications top visualization conferences and journals and he is the recipient of several awards for his research. He is also the co-host of Data Stories, a popular podcast on data and data visualization.
 Reviews

- Video Duration:
 16h
16h - Price: Free 0 Track Price
- Provider:
 Coursera
 - University:
 New York University Tandon School of Engineering
 - Language:
 English
 - Certificate:
 Yes
Yes
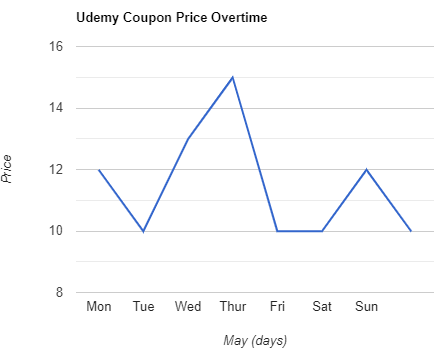
Coursera Coupon Price Tracker