Quality Score
Content Quality
/
Video Quality
/
Qualified Instructor
/
Course Pace
/
Course Depth & Coverage
/
Overall Score : 0 / 100
 Live Chat with CourseDuck's Co-Founder for Help
Need help deciding on a python course? Or looking for more detail on 's Introduction to Data Visualization with Python? Feel free to chat below.
Join CourseDuck's Online Learning Discord Community
 Course Description
This course extends Intermediate Python for Data Science to provide a stronger foundation in data visualization in Python. The course provides a broader coverage of the Matplotlib library and an overview of Seaborn (a package for statistical graphics). Topics covered include customizing graphics, plotting two-dimensional arrays (e.g., pseudocolor plots, contour plots, images, etc.), statistical graphics (e.g., visualizing distributions & regressions), and working with time series and image data.
 Students also recommend

-
Python Tutorial for Beginners by Corey Schafer (2017)
-
4.8 (28 Reviews)
-
 Provider: YouTube
 Time: 9h
Free
 Reviews

- Price: 29 Track Price 29 Track Price
- Provider: DataCamp
- Level:
 Intermediate
 - Language:
 English
 - Certificate:
 Yes
Yes - Quizzes:
 Yes
Yes

30-Day Money-Back Guarantee
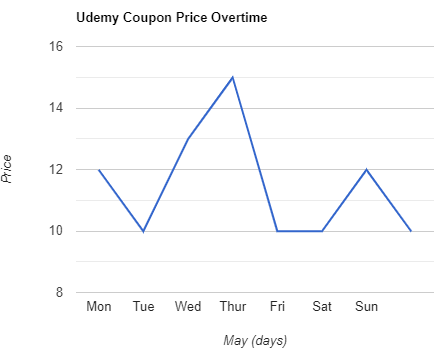
DataCamp Coupon Price Tracker